- Educación
- Análisis técnico
- Análisis técnico
Technical Analysis
To achieve success in the trading market, it's essential to be able to project price movements on the chart. Technical analysis is a vital tool for this task, involving the estimation of price movements based on historical data. By studying the historical movement, you gain insights into where prices are likely headed. The core focus of technical analysis is the historical currency rates or price movement chart. This chart features vertical and horizontal axes, where the former denotes price, and the latter signifies time. Various price patterns often recur within these charts. By familiarizing yourself with these patterns you can estimate prices using specific construction methods and time intervals. Let's start by examining the differences in charts based on construction methods.
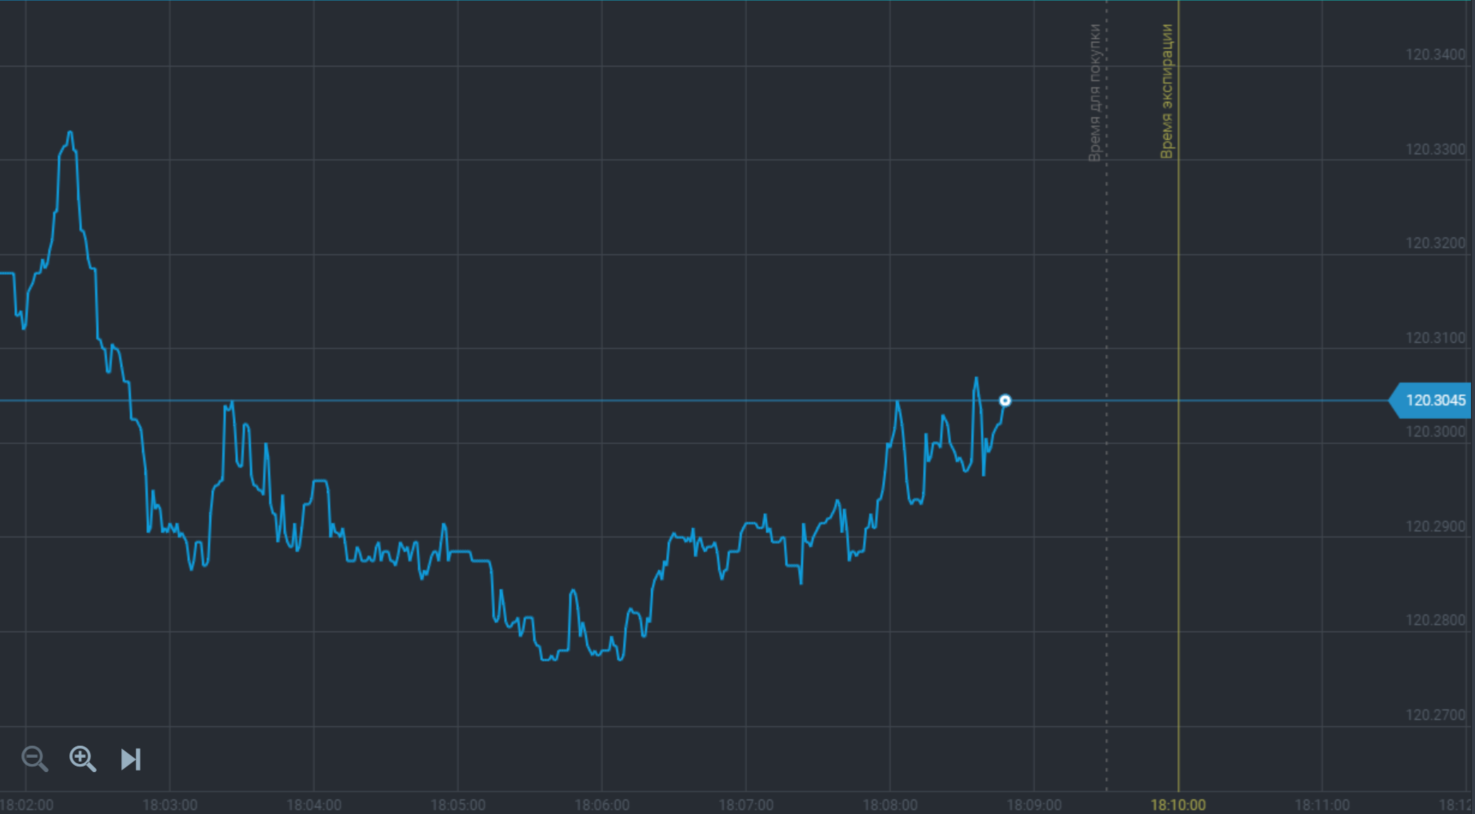
The simplest is the line chart, depicting price changes with individual points connected by lines. These points are fixed at the end of each time interval, creating a visual line connecting subsequent prices. It appears as follows:
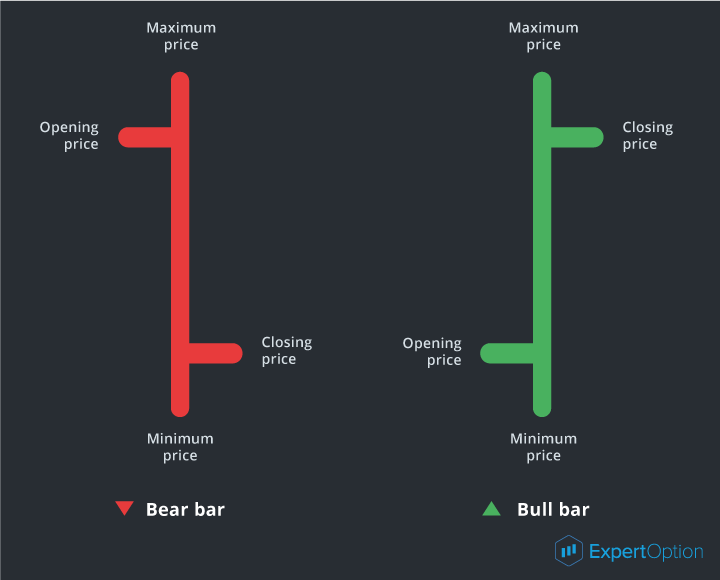
The following type is a bar chart. This chart is made of bars that show the price at the beginning of the time interval (opening price), maximum and minimum prices within this period, and the price at the end of the time interval (closing price). Here's an example of price bars:
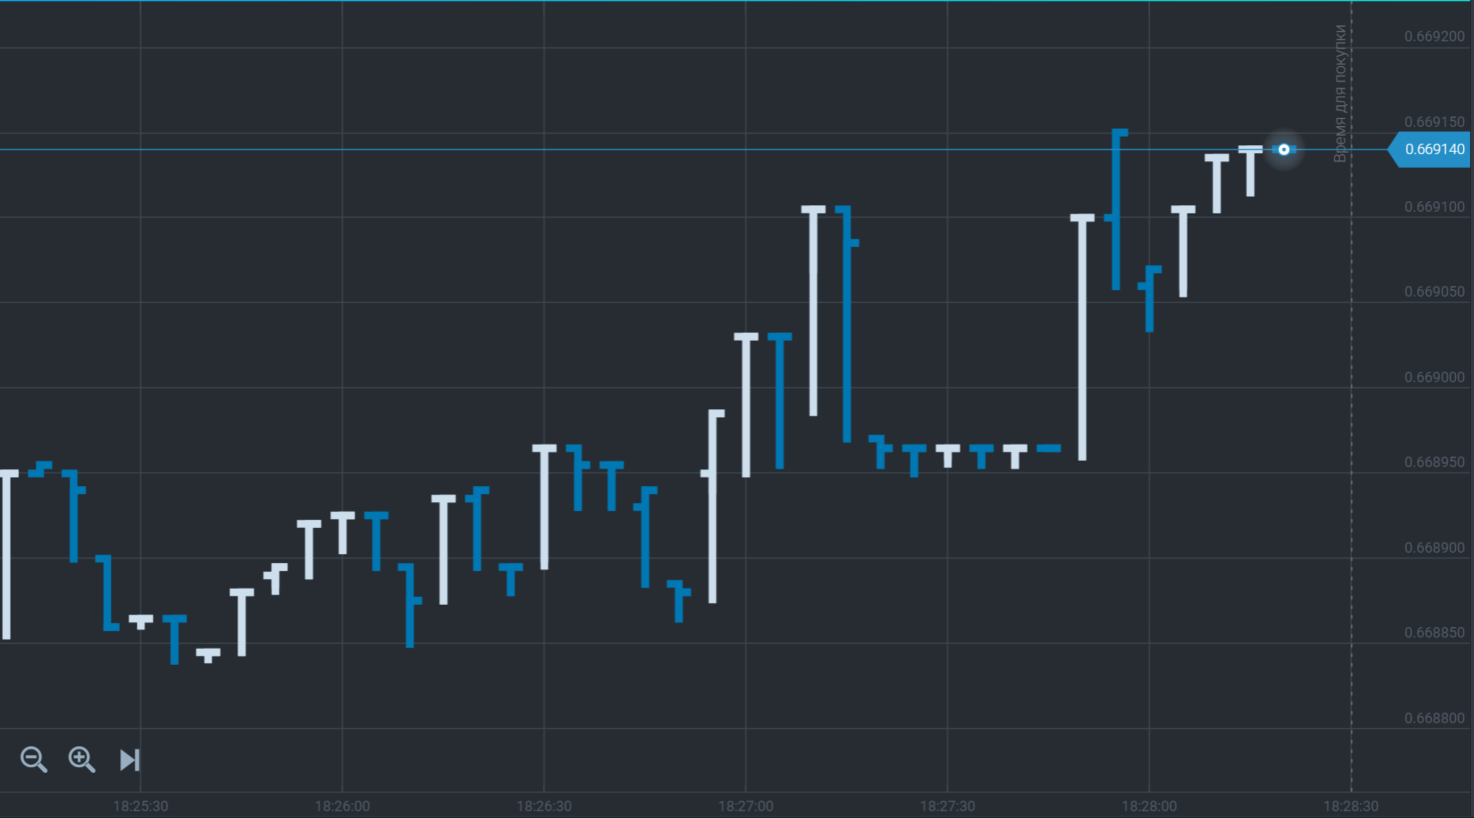
The bar chart appears as follows:
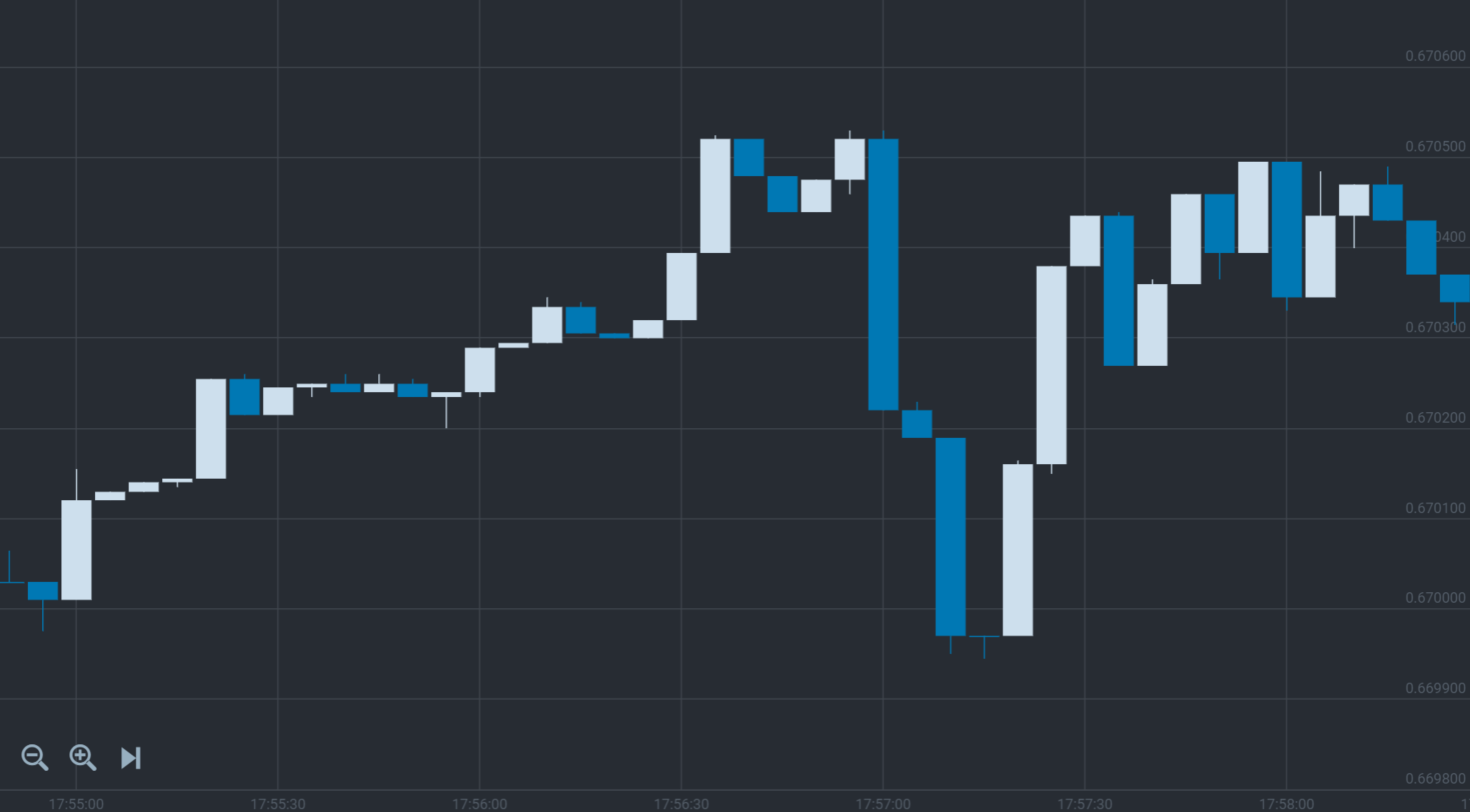
The third type of chart is the candlestick chart. Similar to a bar chart, it presents price information, but in a more visually appealing and user-friendly manner. This is achieved through the use of rectangles known as candlestick bars. Here's an example of candlestick bars:
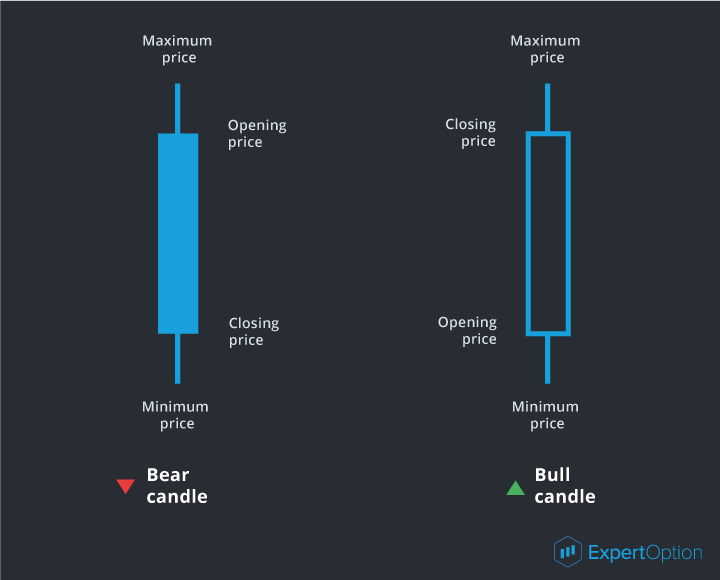
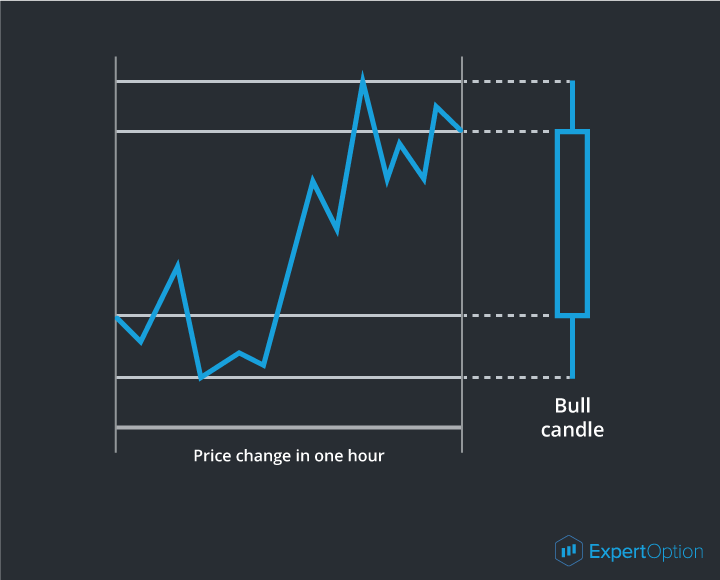
Where a bear candle indicates a downward price movement and a bull candle shows a price increase. A candlesticks chart will appear as follows:
So as we see, there are three types of charts: line, bar, and candlestick charts. Also, the charts are recognized according to a specific period: 1 minute, 5 minutes, 15 minutes, 30 minutes, 1 hour, 4 hours, a day, a week, and a month. The time period is the time interval when the price was fixed on the chart. For example, if the time interval is 1 hour, on the chart we will see a bar or candle indicating the price at the beginning of an hour, maximum and minimum prices within this hour, and the price at the end of an hour. Here's an example:
By adjusting chart intervals, you can conduct a comprehensive analysis of price history across various time frames.
Now, let's delve into the essence of technical analysis. This methodology employs charts to dissect price history and identify recurring patterns. To effectively use price movement history for analysis, we must adhere to three fundamental principles (axioms) of technical analysis:
1) Price progression. Price changes occur consistently, whether it's an upward or downward shift, and this progression follows a distinct pattern. This axiom serves as the cornerstone of trend analysis, leading to the following deductions: the ongoing price direction in the market is likely to persist rather than reverse, and the price tends to continue in a particular direction until it levels out.
2) History repeats itself. If the price level was reached before it can be reached again in the future. The same goes for price behavior graphical models which can appear in the future with the same results as in the past. Studying the history of these price movement patterns allows us to more accurately foresee the further movement direction.
3) Price considers everything. Any event affecting currency price (political, economic, and natural) is factored into the price and it raises or drops depending on the positive or negative effect of this event.
Thanks to the fundamental principles of technical analysis, we gain a higher probability of estimating a price movement, identifying its trajectory, and gauging the duration of such movements. However, it's essential to recognize that the market doesn't always adhere to the patterns found in price movement history. While these exceptional situations can arise, each encounter adds to a trader's experience, enabling them to uncover more foreseeable scenarios and refine their estimations.
So it's crucial to understand that traders with limited experience are better off focusing on the most evident and prominent price movement patterns to achieve optimal outcomes. Technical analysis isn't an exact science; rather, it's akin to an art form. As such, diligent and attentive novice traders stand a better chance of attaining their desired results through dedicated efforts.